Understanding Maritime Scope 3 Emissions: Why It’s Time to Rethink Ocean Freight Carbon Footprints
Scope 3 emissions have become one of the most talked-about parts of corporate sustainability. For cargo owners, freight forwarders, and logistics professionals, understanding what these emissions really are and how to manage them can be the key to unlocking both regulatory compliance and competitive advantage.
This guide will answer your top questions about Scope 3 emissions in maritime transport and explain why most companies are getting them wrong, and how to make better decisions.
What are Scope 3 emissions?
Scope 3 emissions are indirect greenhouse gas (GHG) emissions that occur in a company’s value chain. They are not produced by the company itself or by assets it owns or controls, but they are still a result of its activities.
For example:
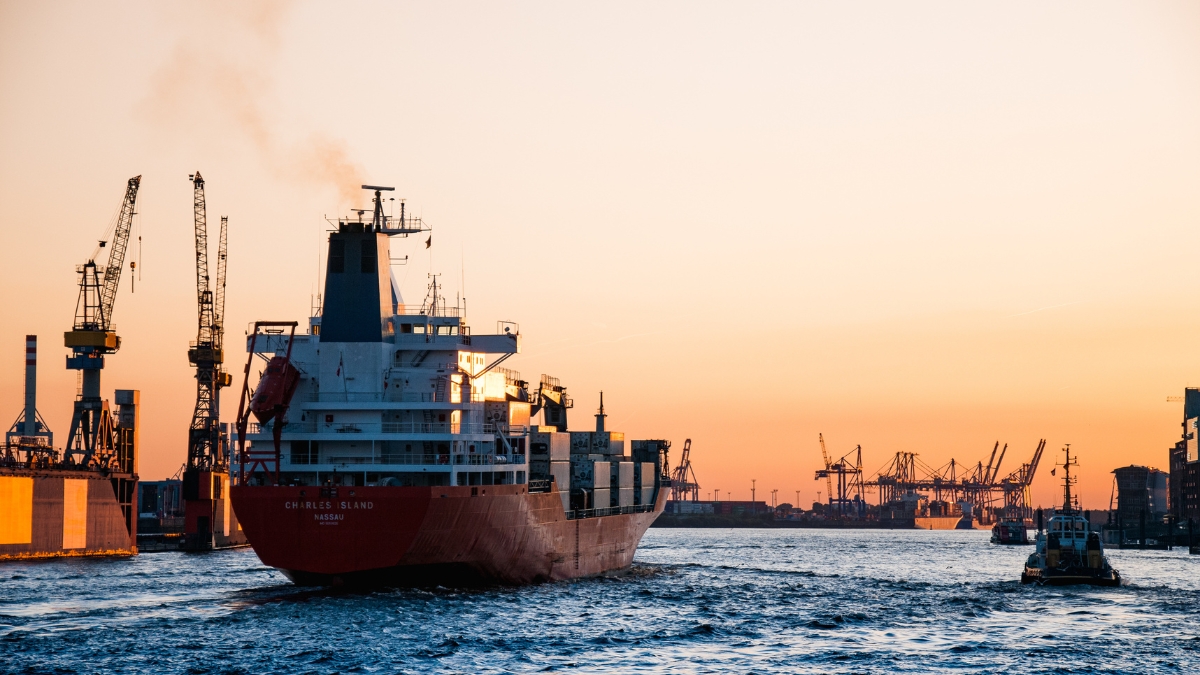
- The fuel burned by a ship transporting your goods? Scope 3.
- Emissions from manufacturing the packaging your product comes in? Also Scope 3.
- Business travel, employee commuting, and even the use of your product? Scope 3.
The GHG Protocol categorizes emissions into:
- Scope 1: Direct emissions from owned or controlled sources
- Scope 2: Indirect emissions from purchased electricity or energy
- Scope 3: All other indirect emissions, upstream and downstream
Why is Scope 3 so important in maritime?
In global supply chains, maritime transport often makes up a large portion of total logistics emissions, especially Scope 3. But here’s the catch: a lot of companies overestimate these emissions by using static trade lane averages. These are generic emission factors that don’t account for real-world conditions like:
- The efficiency of the specific vessel used
- How full it was (utilization)
- Its sailing speed
- Operational decisions made by the carrier
This kind of guesswork can inflate your reported carbon footprint and make it harder to meet emissions reduction targets, comply with regulations, or satisfy ESG reporting standards.
What’s wrong with using average emission factors?
Average data hides important differences.
Imagine two containers on the same route: Hamburg to Porto. One might emit 200 kg of CO₂e, while the other emits 800 kg. Why? Differences in the ship’s utilization, speed, and technical efficiency. Yet if you’re using average data, you’ll miss this entirely.
That means:
- You might be penalizing efficient choices with bloated Scope 3 numbers
- You’re leaving money and carbon savings on the table
You’re missing a chance to gain a competitive edge through better emissions performance
How can voyage-level data improve Scope 3 reporting?
This is where voyage-based emissions tracking comes in.
OceanScore’s “Scope 3 at Sea” report showcases how detailed, per-voyage data, gathered from real-time AIS tracking, advanced cargo estimation models, and emissions calculations can give you:
- Precise carbon intensity by voyage
- Comparisons between carriers, routes, and operations
- Insights into how vessel speed and utilization affect emissions
With this level of detail, shippers and freight forwarders can:
- Choose lower-emission carriers
- Reduce their carbon footprint without compromising delivery schedules
- Benchmark suppliers more accurately
- Turn reporting into real-world impact
Is this relevant only for large companies?
Not at all. While large multinationals face pressure from investors and regulators, companies of all sizes are feeling the impact of:
- Carbon costs and surcharges
- Customer expectations around sustainability
- Mandatory reporting frameworks like CSRD or SECR
Better Scope 3 reporting isn’t just about compliance anymore. It’s about staying competitive.
Where can I find real-world data to improve my Scope 3 reporting?
OceanScore’s new “Scope 3 at Sea” report (Intra-Europe Edition) reveals how maritime emissions really behaved between January to May 2025, across the North European corridor.
Inside the report, you’ll discover:
- Which carriers have been the most carbon-efficient (and which haven’t)
- How speed and vessel loading dramatically shift emissions
- What operational levers your team can control to reduce CO₂ per container
Download the full report here and take the first step toward smarter Scope 3 emissions management.
Final Thoughts
Maritime emissions aren’t one-size-fits-all. The difference between an optimized voyage and an inefficient one could be the difference between meeting or missing your climate goals.
Don’t let averages define your sustainability strategy. Use more accurate data to make real change.